
Regular readers of these tips will be aware that I spend a lot of time in Normandy researching the stories of 18 Allied servicemen who were held as Prisoners of War by the German Army following the D Day landings in June 1944 (the full story is here: www.menintheshed.com)
We’ve recently started a review of the website as it’s grown a bit like “Topsy” with the various additions and so, to enable us to work out how the new site should look, I decided to sketch it out using SmartArt in PowerPoint – in particular the Organisation Chart option as this allowed me & the team that help with the site visualise it more easily.
So, let’s work through the basics and then we’ll see what I created.
Creating and formatting an organisation chart
- Click on the Insert tab and from within the Illustrations group click on the SmartArt button.

2. This will display the Choose a SmartArt Graphic dialog box. Click on the Hierarchy button and select the style illustrated.
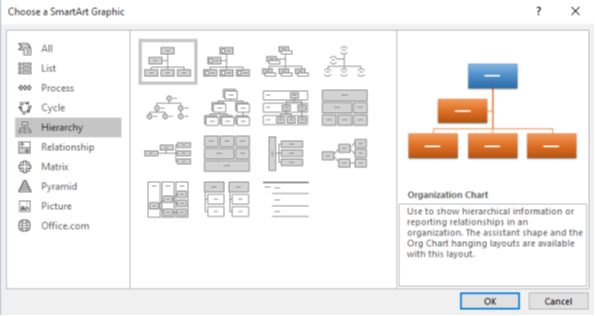
3. Click on the OK button and you will see an organisation chart displayed within your slide.

4. Type in the words Head Office into the top box. You will see that this text is displayed within the top box within the organisation chart.

5. Click on the next item down and enter the word Shipping. Your organisation chart will now look like this.

6. Within the dialog box to the left enter text for the next three items using the words Western Region, Central Region and Eastern Region. Your organisation chart will now look like this.

7. Now that you have created an organisation chart you can apply smarter styles by selecting an option within the Smart Art Styles group. If you click on the down arrow within the group, you will see additional styles displayed.

8. Select the Bird’s Eye Scene style.

9. Your chart will now look like this.
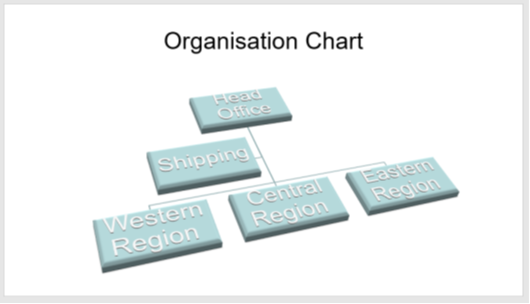
10. If you click on the Change Colors button, you will see a drop down allowing you to apply a colour scheme.
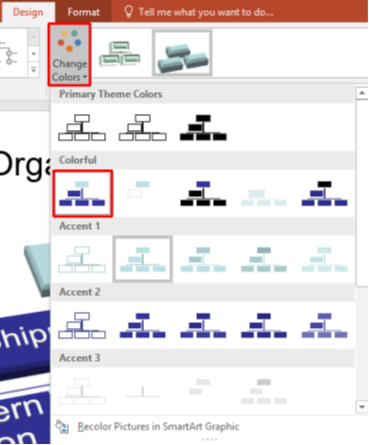
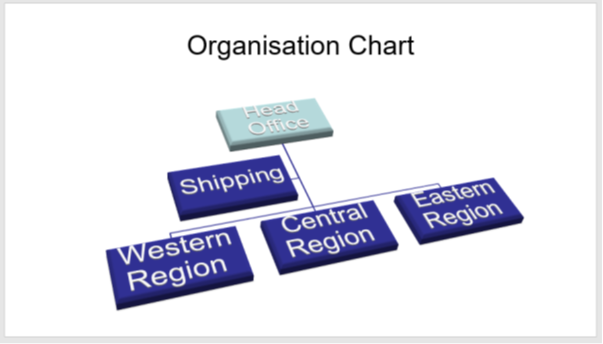
11. Your slide will now look something like this.
An alternative method of creating your Organisation Chart
Having inserted a new slide into your presentation, either by selecting the Title and Content layout by clicking the down arrow under New Slide…

… or by creating a new slide and amending the layout…

You’re presented with the option to insert SmartArt…
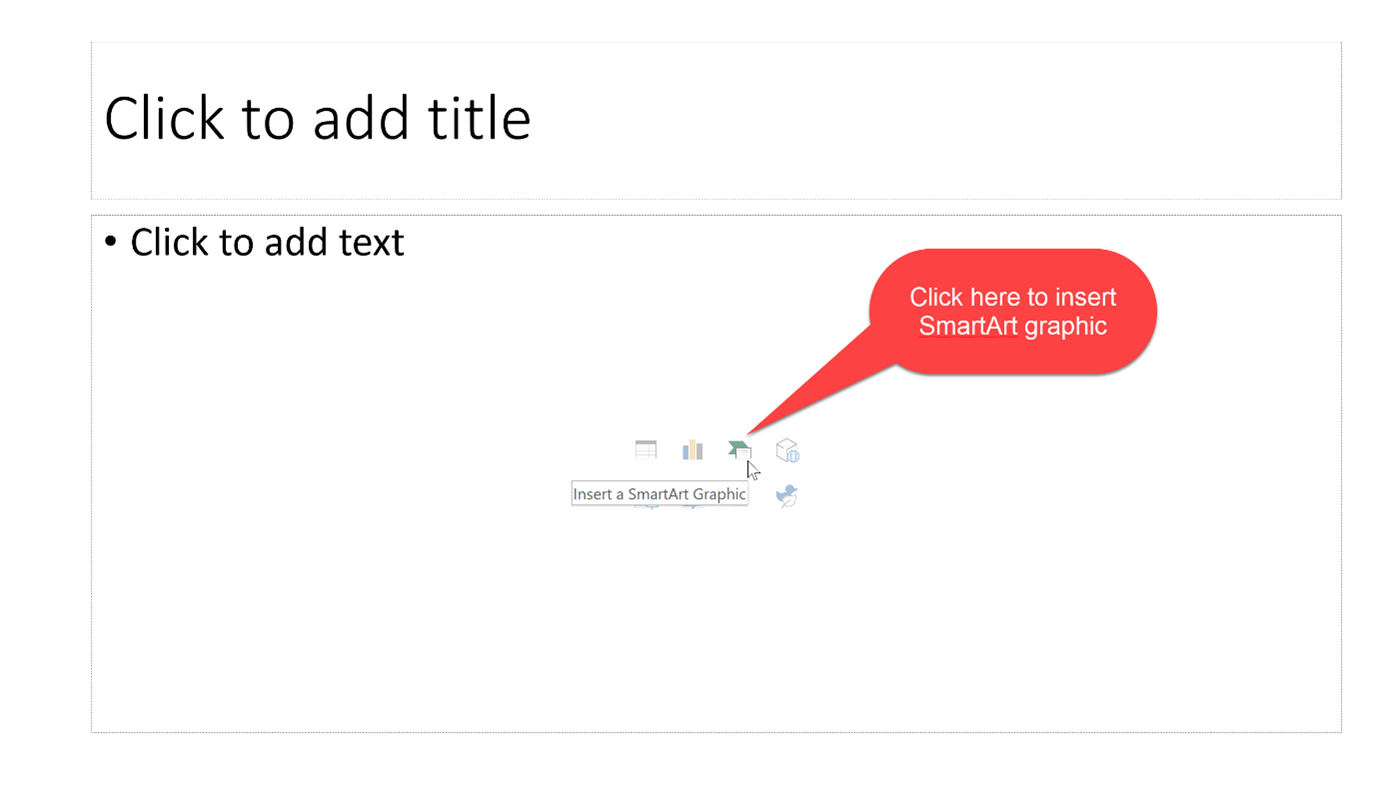
Which takes us to the same place as at the start of this tip.

An alternative way to add data
Once you’ve inserted the draft Organisation chart, rather than typing into the boxes, if you click on the Expand arrow, you’re presented with a bulleted list where you can add your information.

Which takes you to…

Adding more levels
Once you have the basic organisation chart, you may need to add more levels either subordinates, or colleagues.
Whilst you’re “in” the Organisation chart the SmartArt Design Tab is active, on the left-hand side of which are options to add further items or reorganise your layout

- Click the SmartArtgraphic that you want to modify.
- Under SmartArt Tools, on the Designtab, in the Create Graphic group, click the Add Shape list button:
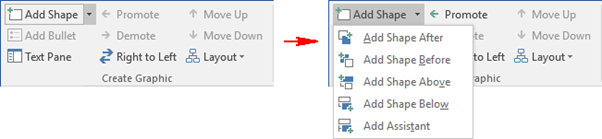
3. To enter the text into a new shape, do one of the following:
- Click inside the shape of the SmartArt graphic, and then type your text.
- Click [Text] in the Text pane, and then type your text.
4. To change the hanging layout of new shape, under SmartArt Tools, on the Design tab, in the Create Graphic group, click Promote, Demote, Move Up or Move Down buttons to drop a new shape from one level to another into an organizational chart:

The MenintheShed website layout
So, making use of all of the above – including recolouring like items, for my new website (www.menintheshed.com) layout we have…

We’ve even incorporated an organisation chart-style sitemap into my work website at https://us4b.co.uk/site-map/ because they make navigation so straightforward…
